Published: April 02, 2025
The Performance panel in Chrome DevTools is incredibly powerful, containing data for almost any possible problem in your site's runtime behavior. That wealth of data can be overwhelming, though: it can be difficult for many developers to know where to start, and even experts can have trouble isolating a particular issue within a complex page load.
Tools like Lighthouse were developed to address this, analyzing performance traces and reporting a concise list of potential issues and how you might address them. But this has a tradeoff as well: disconnected from the details, it can be difficult to see when in the timeline that issues occur relative to each other. And, if you want to understand the context within the full trace, you have to start from scratch in the Performance panel.
The new Insights sidebar is bridging the gap by bringing Lighthouse insights directly into the Performance panel. Recommendations are now right in the panel when looking at a trace, but, more importantly, the integration allows insights to highlight events and overlay explanations directly in the performance timeline. Hover over an insight to zoom in and highlight the relevant parts of the trace, visualize critical paths, or flag performance bottlenecks within their full context.
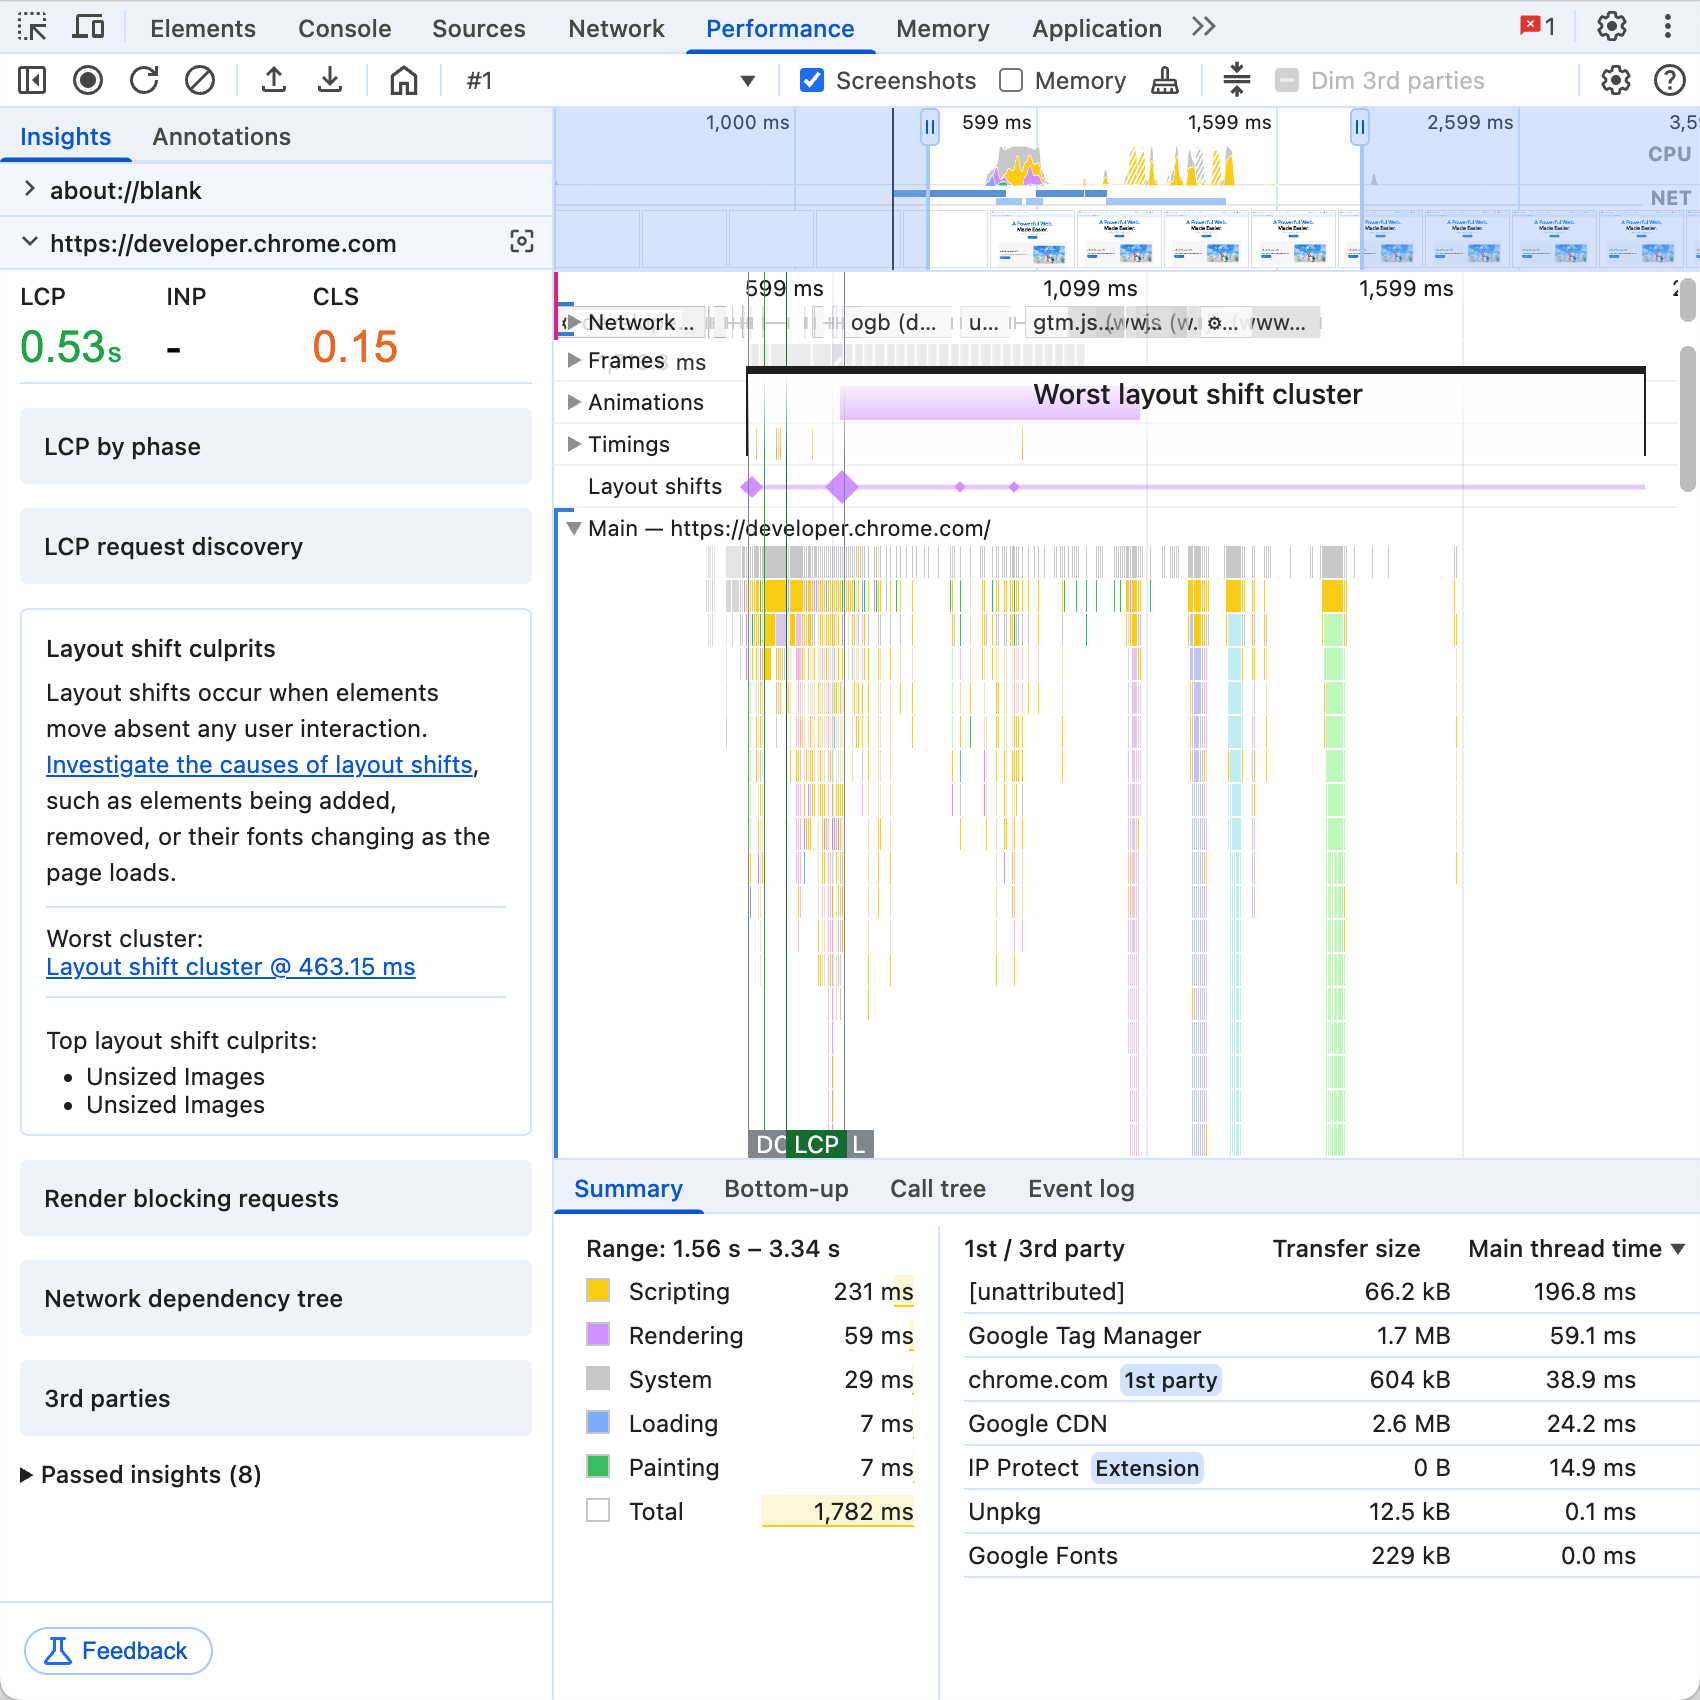
Using the Insights sidebar
You may have already noticed the new sidebar, which was added in Chrome 131 with some initial insights and has gained more insights in each new Chrome release since.
To see it, hit Record in the Performance panel, load a URL or interact with a page, and then stop the recording. The sidebar may be collapsed to the left-hand side of the Performance panel if you've closed it in the past. To reveal it, click the button, and there will be a list of insights to serve as entry points to investigating performance issues.
Similar to a Lighthouse report, the sidebar will list a set of insights for the recording you just took, identifying performance or UX issues, or providing data to help you filter and diagnose issues yourself. At the bottom is a collapsed Passed insights section, which has insights that weren't identified as problematic for this recording, whether because a particular performance issue didn't occur, or the insight just wasn't applicable at all (for example, if you took a trace of interactions with the page and didn't navigate).
Finally, if the trace you recorded includes navigations to multiple pages, each page will get its own set of insights that you can flip through to investigate each navigation separately. Click the icon next to the URL and the timeline view will zoom into the part of the trace which occurred while on that page.
Insights for page load
A fast page load is essential for a good user experience, and Largest Contentful Paint (LCP) is the Core Web Vital focused on measuring page load. The Insights sidebar offers dedicated insights for improving LCP, as well as insights for aspects of page load beyond LCP.
LCP insights
For understanding and improving LCP, a good place to start is with LCP phases, an approach to breaking down the time to LCP into four subparts and addressing them separately.
Click LCP by phase in the Insights tab on the left, and the breakdown of time spent in each subpart is shown in the Insights tab. Hovering or clicking on each subpart in the Insights tab will highlight or zoom into each subpart in the performance timeline, to investigate events within that period. If you have Field data enabled and image LCP load data is available for your site, the 75th percentile values for the subparts will also be included in the insight.
LCP request discovery will suggest improvements in how to load the LCP resource, one of the most common issues affecting LCP across the web. It overlays the timeline with annotations that mark when the image could have been loaded, and the estimated loading time that could have been saved.
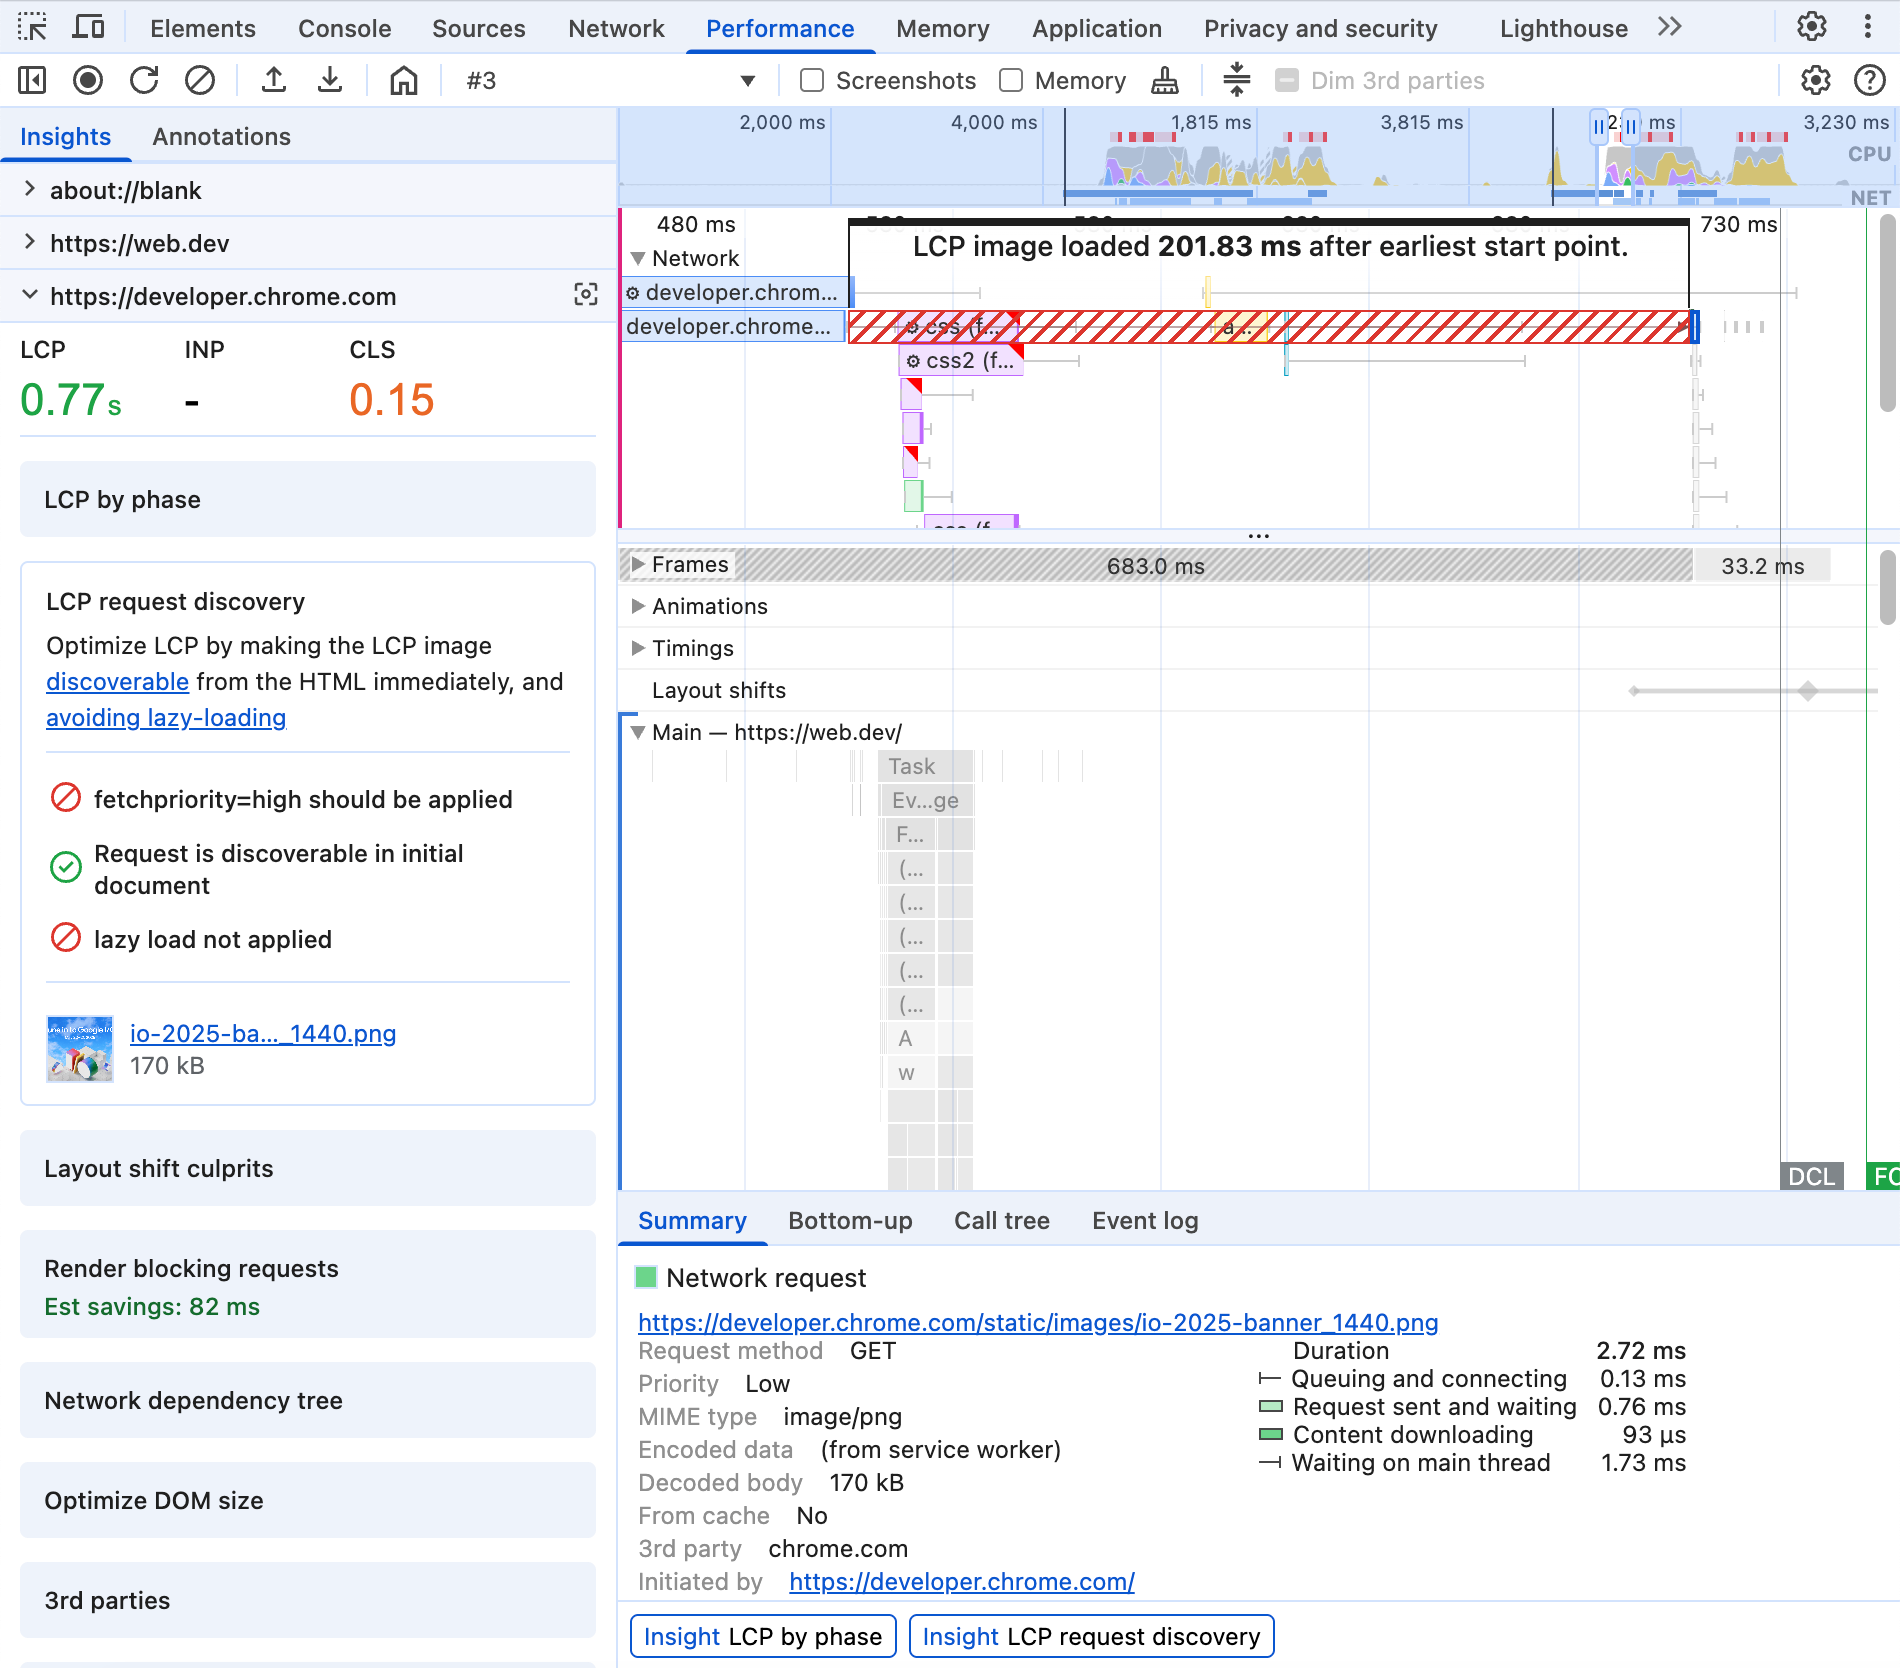
Further insights help identify issues within LCP subparts. Document request latency highlights potential optimizations in the navigation request to the server. Render blocking requests points out requests that will block the initial render of the page until they are complete, even if content (like LCP) is ready to be displayed.
Page load insights beyond LCP
Additional insights help identify potential issues impacting overall page load performance beyond LCP.
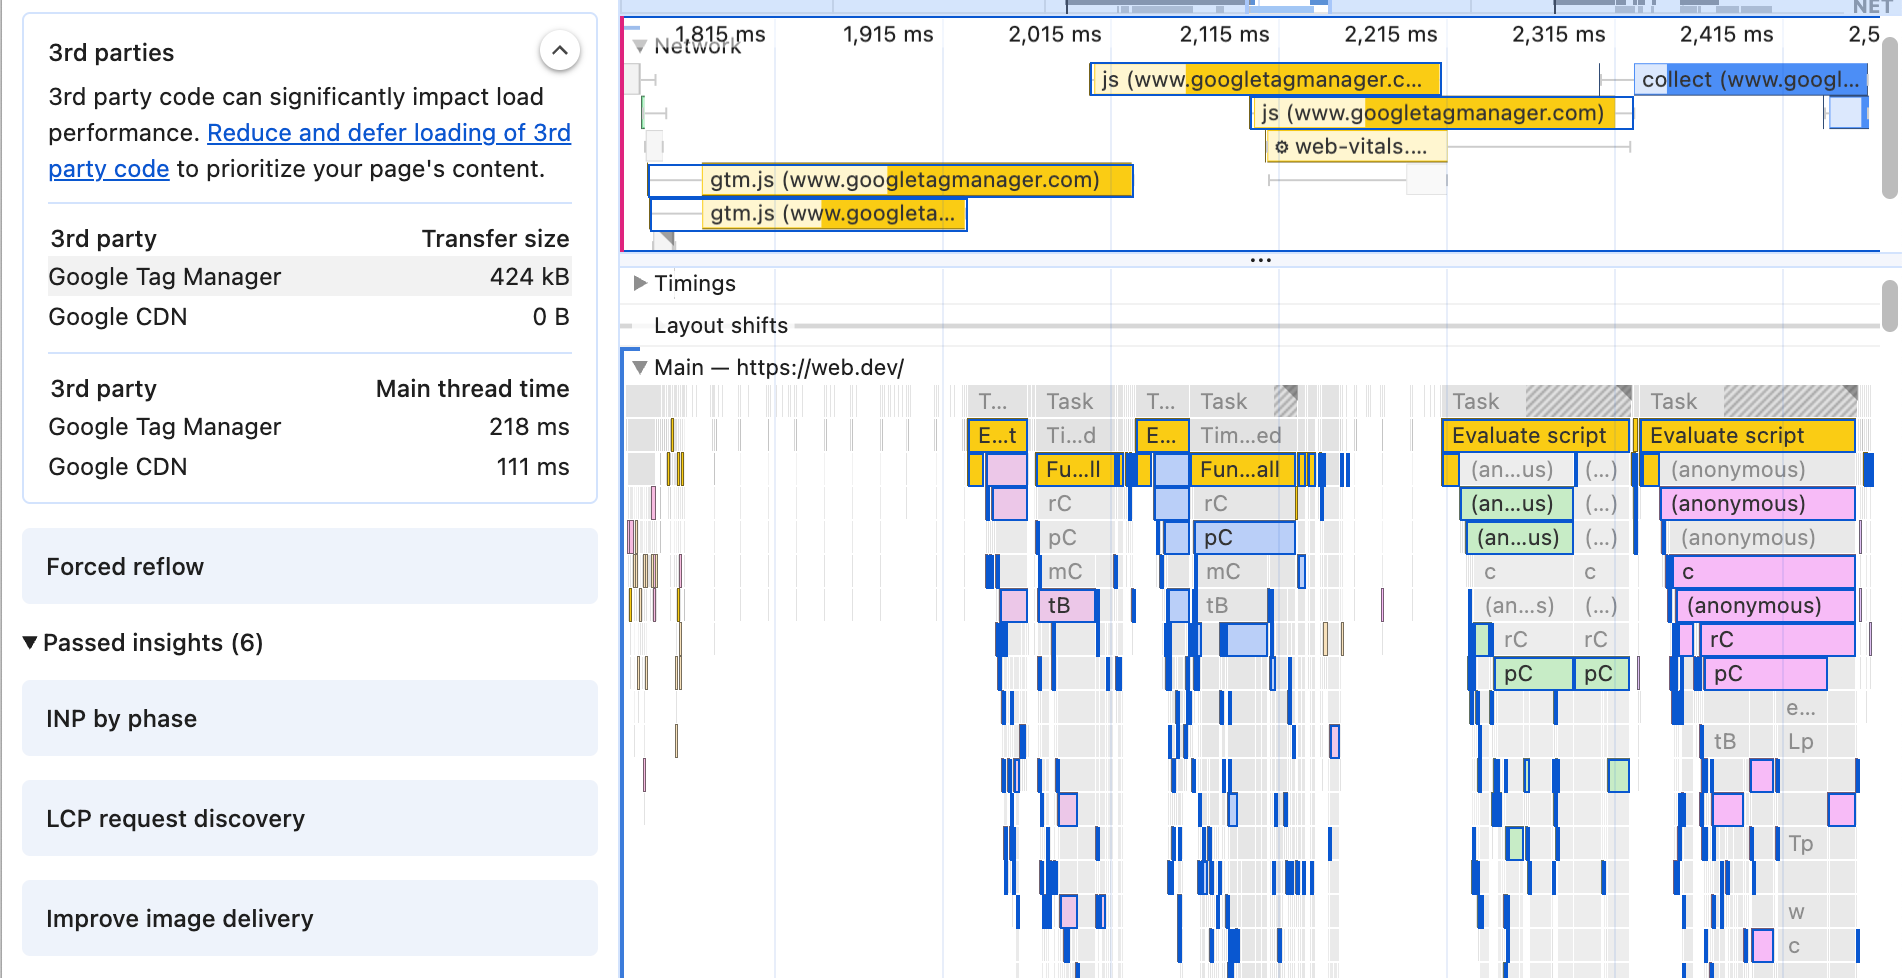
One of the biggest challenges is the performance of third party resources. Often they're necessary for business reasons, but web developers have little direct control over their performance. The 3rd parties insight categorizes resources and CPU activity by first and third-party entities, showing which entities consumed the most time and resources. Hovering over each entity will highlight their activity within the performance and network timelines. This insight works in tandem with the "Dim 3rd parties" checkbox and the new 1st/3rd party entries in the Summary tab.
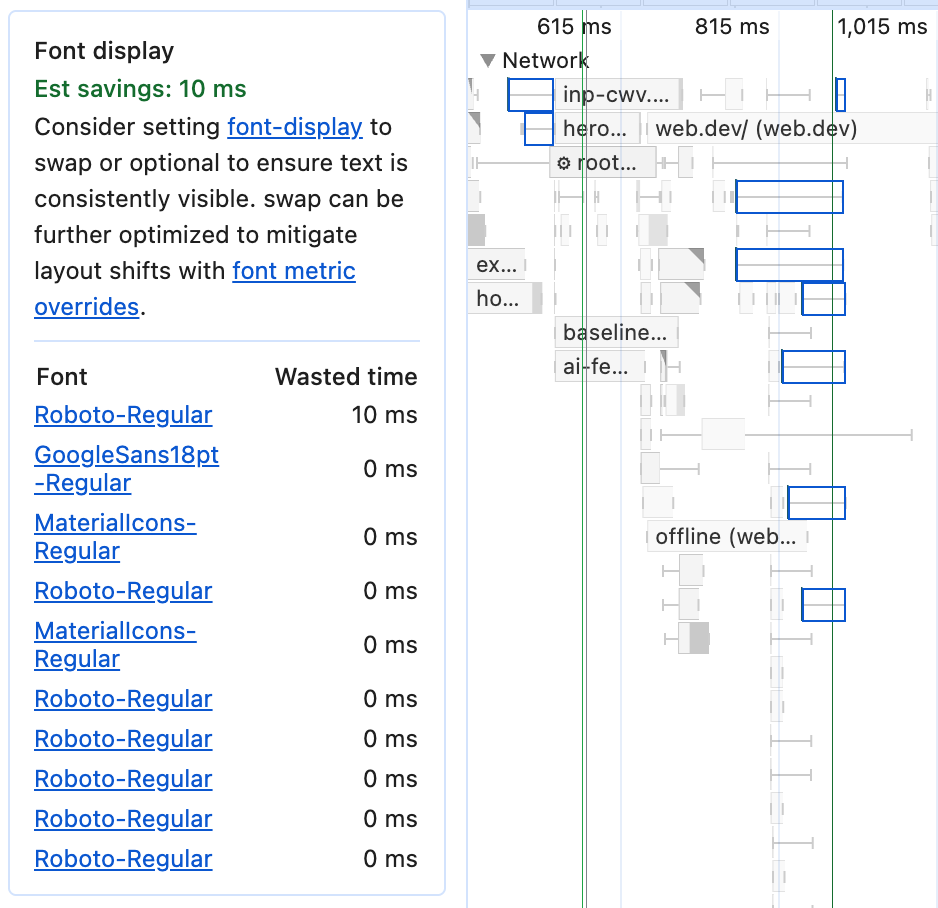
Font display will list fonts that could have used font-display: swap or optional to not prevent text from being shown during font loads.
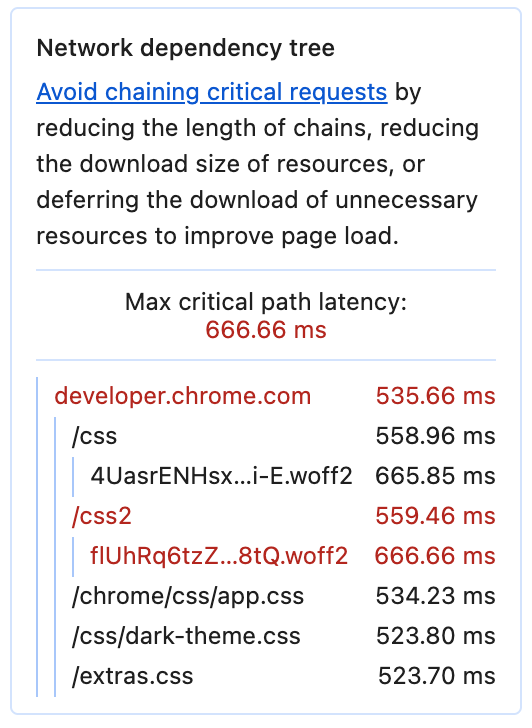
Network dependency tree identifies long chains of dependencies within your page load, where resource A loads resource B loads resource C, and C is important for the look or functionality of the page. Each dependent request can add significant latency to loading the full chain, especially for users on worse connections.
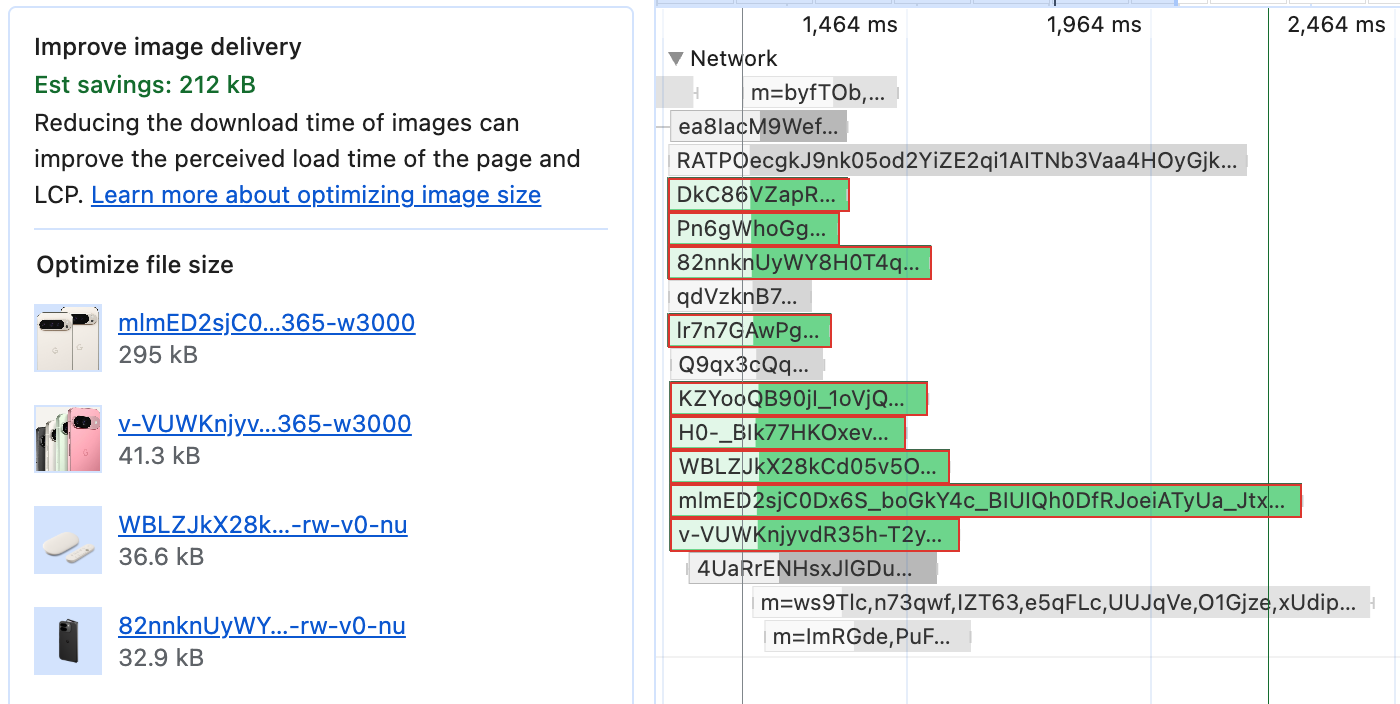
And finally, for image resources, Improve image delivery identifies images that could be significantly optimized, potentially wasting significant download time fetching unnecessary extra bytes.
Insights for responsiveness
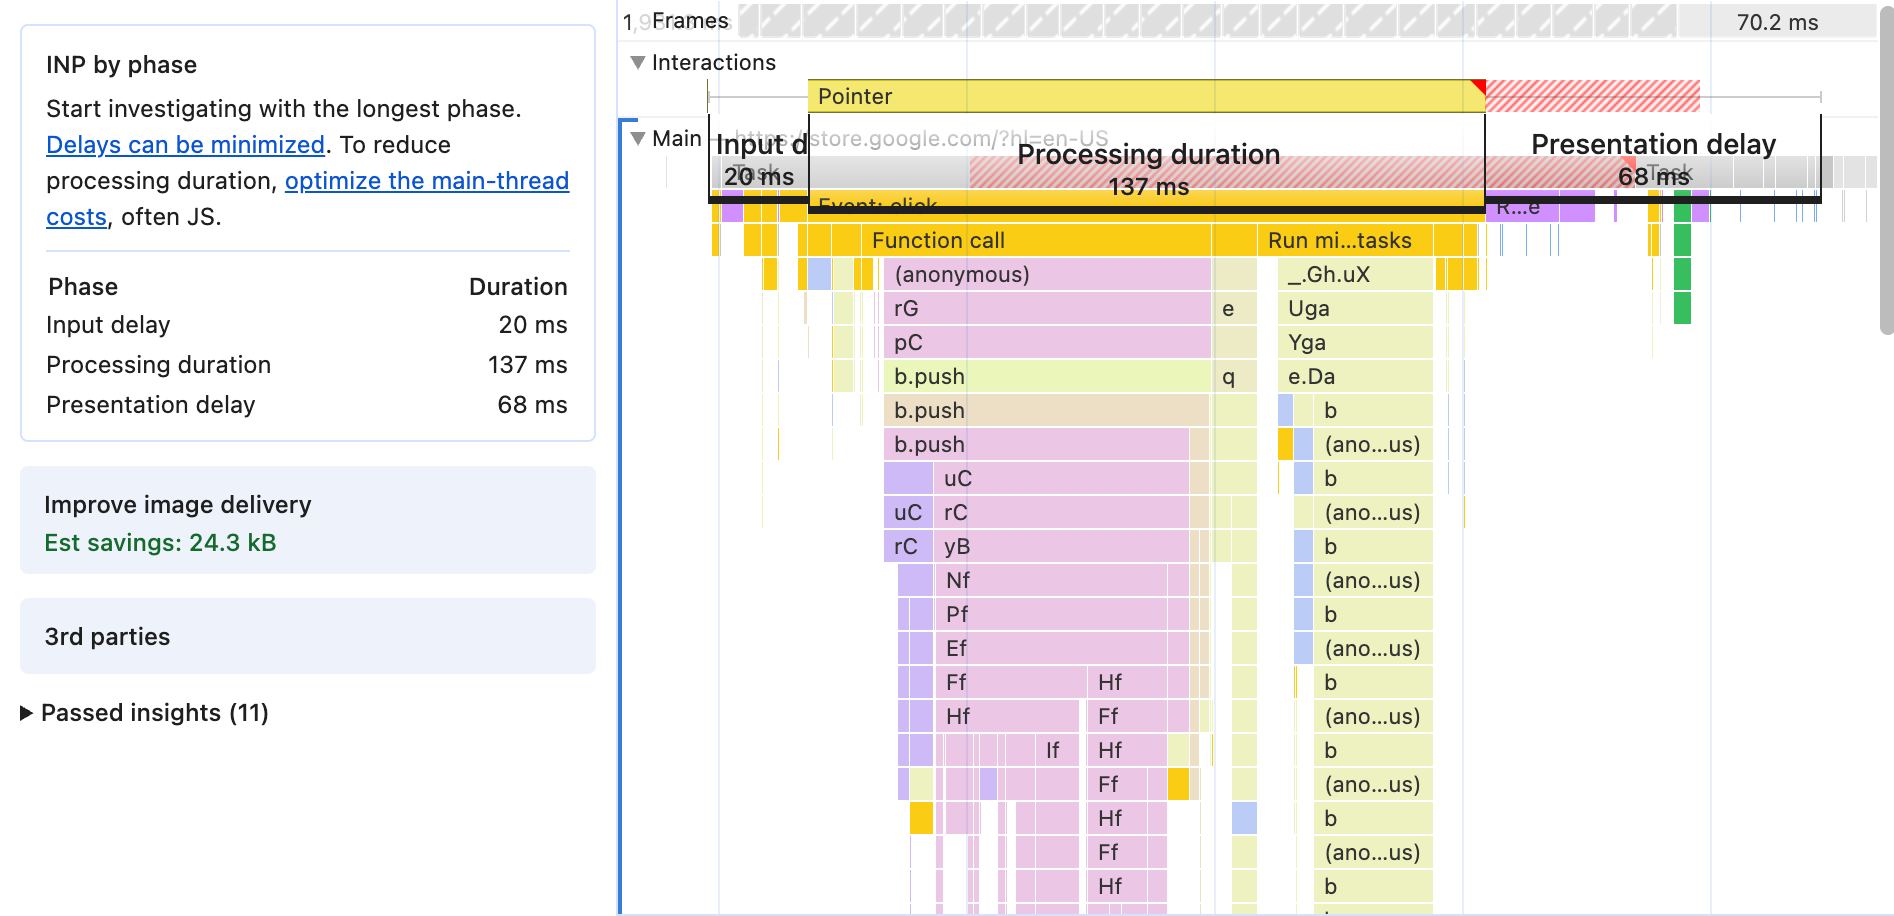
Interaction to Next Paint (INP) can be broken down into subparts, similar to LCP. The INP by phase insight will add overlays to the performance timeline to highlight these subparts, helping you see their direct relation to main thread activity.
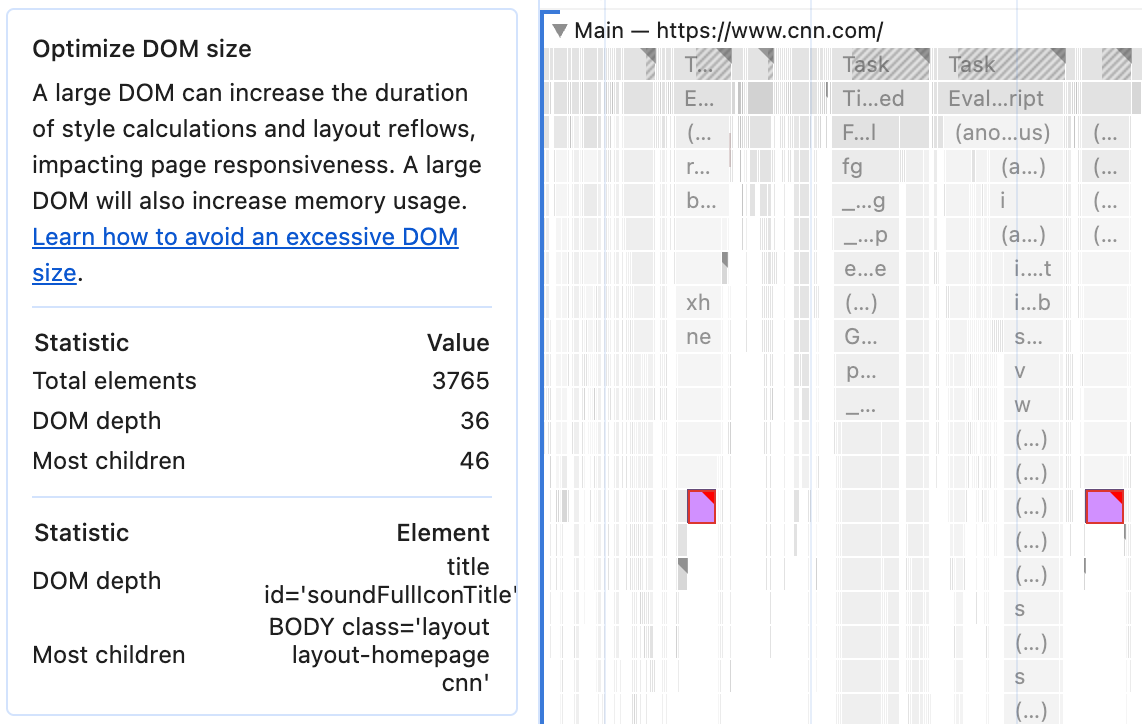
Interactions that update the page often spend significant time recalculating styles and layout. One of the best predictors for how long style and layout will take is the size of the DOM, both in the total number of nodes and the depth of the tree. Optimize DOM size reports the page's DOM size, and highlights events that were likely made worse by the large DOM size.
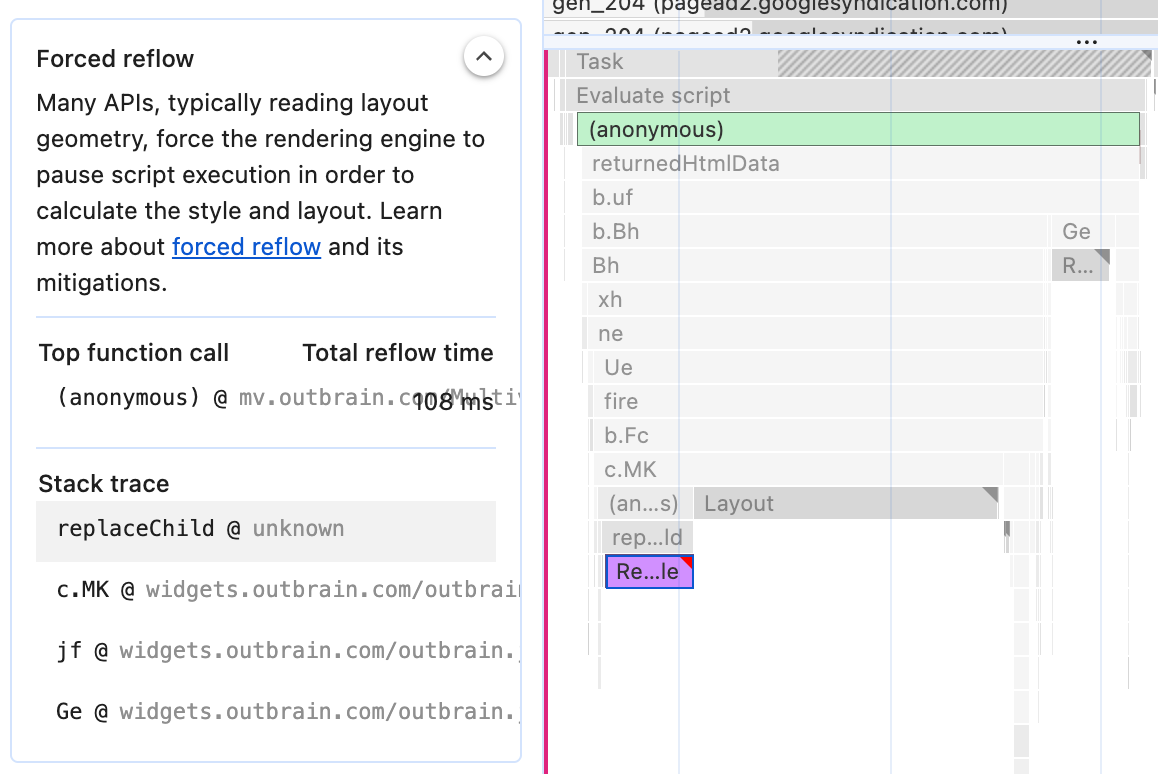
Forced reflow alerts on a common threat to responsiveness: interleaved reads and writes to the DOM that require the browser to do layout, for example adding new elements to the DOM then calling a DOM function that reads the size of some element on screen. Even if you know that two parts of the DOM don't affect each other's layout, without explicit content containment, the browser may still be forced to re-layout the full page due to unknown dependencies between the two.
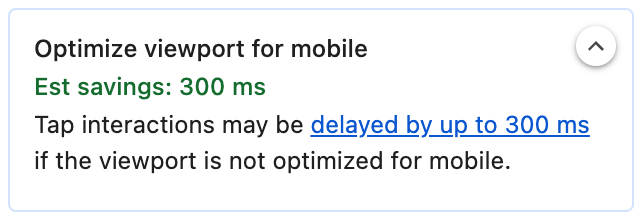
Most pages on the web now set an explicit mobile viewport, but if they don't, they risk spending hundreds of extra milliseconds on every click while the browser waits for possible additional input. The Optimize viewport for mobile insight alerts when the viewport isn't set correctly.
Finally, if the Enable CSS Selector stats (slow) option is selected, the CSS selector costs insight will appear, providing an overview of style recalculation performance. Note that the Enable CSS selector stats (slow) option that needs to be enabled for this insight will slow down page performance significantly.
Insights for layout stability
Cumulative Layout Shift (CLS) gets its own Layout shifts track within the timeline, showing individual shifts grouped into windows (clusters) of up to five seconds, which are used to calculate the CLS score.
The Layout shift culprits insight highlights the worst CLS cluster, and lists the individual layout shifts within it. Hovering over each shift in the list or the track will show a screenshot of the page, visualizing the shift with an animated overlay.
Conclusion
Insights aim to bring the power of Lighthouse into the full context of the Performance panel, making traces easier to understand and making insights connected to the data they come from.
We are actively improving the current insights and more are on the way. Try out the Insights sidebar and let us know all the ways they could be improved or what other insights you'd love to see.

