Published: April 04, 2025
Fixing performance issues in the real world means bridging the gap between your development environment and the diverse performance experiences of your users. In this post, we'll look at new features in Chrome DevTools that help you base more of your performance debugging decisions on real data rather than guesswork.
Calibrating expectations
Starting in Chrome 134, DevTools includes CPU throttling calibration, a new tool to remove the uncertainty of picking the right CPU throttling level. Run the calibration once, and DevTools will generate "low-tier mobile" and "mid-tier mobile" throttling presets for you, specific to your development machine.
A common mismatch in web performance work is that, as developers, we often build sites on fast desktop devices while many of our users are on more modest mobile devices. Tracking down a performance problem can be tricky when it only happens on a device with a much slower CPU.
The gold standard is remote debugging on a real mobile device, but for almost a decade Chrome has also supported CPU throttling for fast and lightweight iteration cycles during development.
But which CPU throttling level should you choose? 4x? 20x? How do you know which best matches the type of devices you know visit your site? And how does the speed of your own machine change that decision, whether you're on a high-end workstation or using an 8-year-old Chromebook on the go?
The throttling calibration process
When the Performance panel is opened, the Environment settings has a drop-down to set the CPU throttling level. If you haven't run the calibration before, you'll see two disabled options under "Calibrated presets" in the drop-down, and a Calibrate… option at the very bottom.
Selecting this will bring you to the CPU throttling presets in Settings (you can also go there directly).
- Click the Calibrate button
- Click Continue when it warns you that it will briefly navigate away from the current page
- A quick benchmark will run to measure the speed of your current machine, and calibration is complete
The throttling options will now be populated with the calibrated presets for low-tier and mid-tier devices.
These two presets should be enough for most development use cases, and we generally recommend the "mid-tier" preset as matching a "typical" mobile device seen on the web. If you know that many of your users have even slower devices or a performance issue only typically occurs for those users, the "low-tier" option should be slow enough to capture even the long tail of low-end devices.
Finally, if you think something went wrong with the calibration or your local machine has changed in some way, you can always recalibrate through the throttling drop-down or in settings, which will re-run the benchmark and update the presets.
How CPU throttling works in DevTools
If you've ever been curious about how CPU throttling works in DevTools, the idea is relatively straightforward. When you turn on throttling for a tab, Chrome launches a separate throttling thread that interrupts and suspends the tab's main thread for frequent short bursts. The goal is to suspend the main thread long enough in total that the duration of any given task goes up by the throttling factor.
For example, at 4x CPU throttling, the main thread will end up suspended approximately 75% of the time, which makes any main-thread work take four times as long to complete.
The benefit of this approach is that it's mostly transparent to the rest of Chrome; there's no specialized code needed to slow down JavaScript, or layout, or each of the many other types of work a browser needs to do. All work on the main thread takes longer because the thread itself is only allowed to execute for a fraction of the time.
When CPU throttling acts like a real mobile device
As a result, many types of mobile CPU-bound work are simulated well by CPU throttling. If an interaction triggers javascript and layout, for example, it has a good chance of resulting in executing very similarly to how it would have run on a mobile device.
Consider a task triggered by the click of a button, running Javascript to add new elements to the DOM, which then requires the browser to run Style and Layout calculations to position the new content:

With the calibrated "mid-tier mobile" CPU throttling preset (3.7x on this development machine), the interaction looks very similar, but the duration increases significantly, becoming a long task:

Testing the same interaction on a real mid-tier device using remote debugging yields a remarkably similar result, in both the shape and duration of the interaction's trace. Because this task is mostly CPU bound in the main thread (executing the page's JavaScript code and Chrome's style and layout code), the calibrated throttling accurately recreates the real mobile performance:

When you might still want to test on a real mobile device
While very useful, CPU throttling can't simulate all aspects of mobile hardware. On a phone, disk speed is slower, memory bandwidth is more limited, and thermal throttling can kick in at any time to cut back execution speed.
A common throttling limitation involves GPU-intensive work. Mobile and desktop GPUs differ architecturally, and Chrome runs GPU operations in a separate process from the page's main thread. As a result, DevTools CPU throttling doesn't touch the GPU process (which is for the best, as that would impact the responsiveness of DevTools itself and the rest of the browser).
Complicated painting, compositing, and effect-heavy styling are common performance issues that can seem fine on a development machine, but unexpectedly slow on mobile. And it can be tricky to realize there is a problem at all when trying to recreate the issue on your development machine.
Consider the same interaction as before (click and add many elements to the DOM), only this time the new elements are styled with an excessive number of GPU-heavy box-shadows and blur filters.
The beginning shape and duration of the interaction looks similar, but there's a lengthy new main-thread paint at the end of it for the added effects:

On a real mid-tier phone, the main-thread portion of the interaction looks very similar to the simulated one, including the extra paint, but then a wild GPU process appears to do an enormous amount of work before the result of the interaction can appear on screen:

The GPU work lengthens the interaction by another 300 milliseconds, and is work that barely exists at all for the laptop GPU, even with (main-thread) CPU throttling enabled.
There are a few other cases that have significant emulation drawbacks, too, like deep-dependency page loads, where there's an interplay between simulated network throttling, inter-process communications, and accessing disk and memory caches.
Always make sure to test on real mobile devices at some point. And if you can't recreate a problem in the lab on your desktop machine that your field data shows is affecting mobile users, definitely try out remote debugging with a real device to see if there's a difference you're missing.
More data-driven debugging improvements
Some other new features have recently landed to help make it easier to base debugging settings and decisions on your real users.
If you have field data enabled, the Performance panel will give suggestions about throttling based on your 75th percentile users as measured by the Chrome User Experience Report (CrUX), and the real-time metric view will alert you if your locally measured metrics diverge from the field data. This was covered in detail in an earlier post about bringing real-world Core Web Vitals data into DevTools.
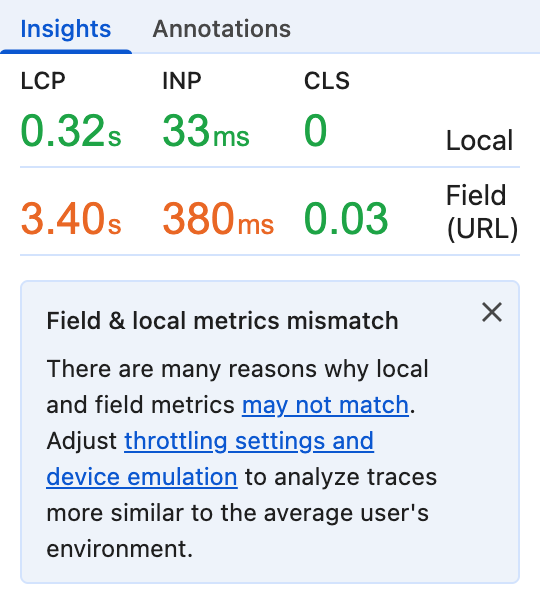
One new addition is that the Performance panel insights in the sidebar will now also alert you if the metrics measured in a trace don't match what your users are experiencing in the real world.

Having field data enabled will also unlock using your 75th percentile Core Web Vitals to help rank the order in which insights are shown in the sidebar. If, for example, your users typically have great Largest Contentful Paint (LCP) but poor Interaction to Next Paint (INP), insights that help with improving INP will tend to end up at the top of the list.
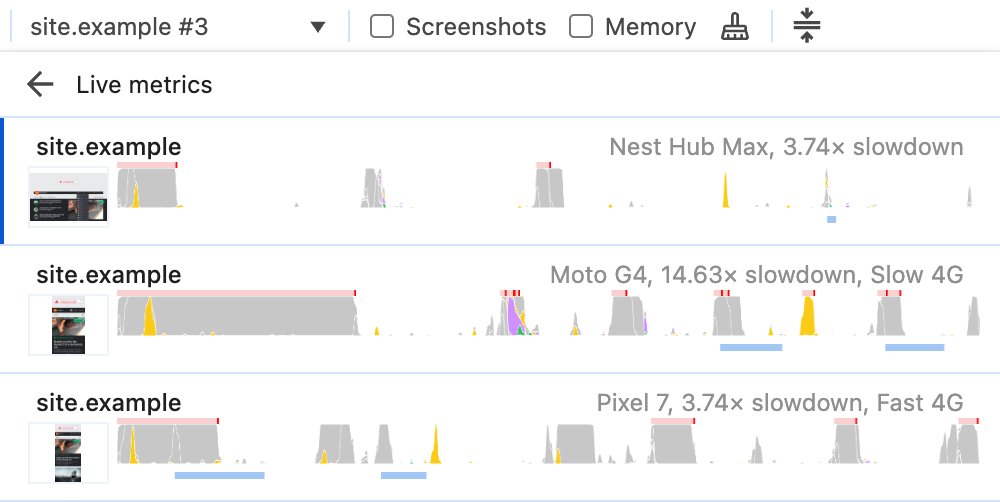
And finally, if you've ever been flipping back and forth between multiple traces, or loading traces from disk, it can be difficult to remember exactly what mobile emulation and throttling settings you used in each trace. The trace selection drop-down at the top of the Performance panel now shows emulation information for each trace.

Stop, calibrate, and listen
Ultimately we need to base our debugging decisions on the real world: starting with field data from analytics and user reports to find issues, then recreating those user experiences in the lab for diagnosis. These new DevTools additions should help make that process a little easier.
CPU throttling calibration and alerts on diverging field and lab experiences help reduce the uncertainty of whether or not you're on the right path and enable a more consistent approximation of real-world performance. By taking guesswork out of configuration and highlighting potential discrepancies, DevTools aims to help you spend more time focused on fixing the actual performance issues affecting your users.
Have ideas for more improvements or suggestions for new features? Let us know!

